Fuel efficiency comparison shows real-world MPG is far worse than quoted

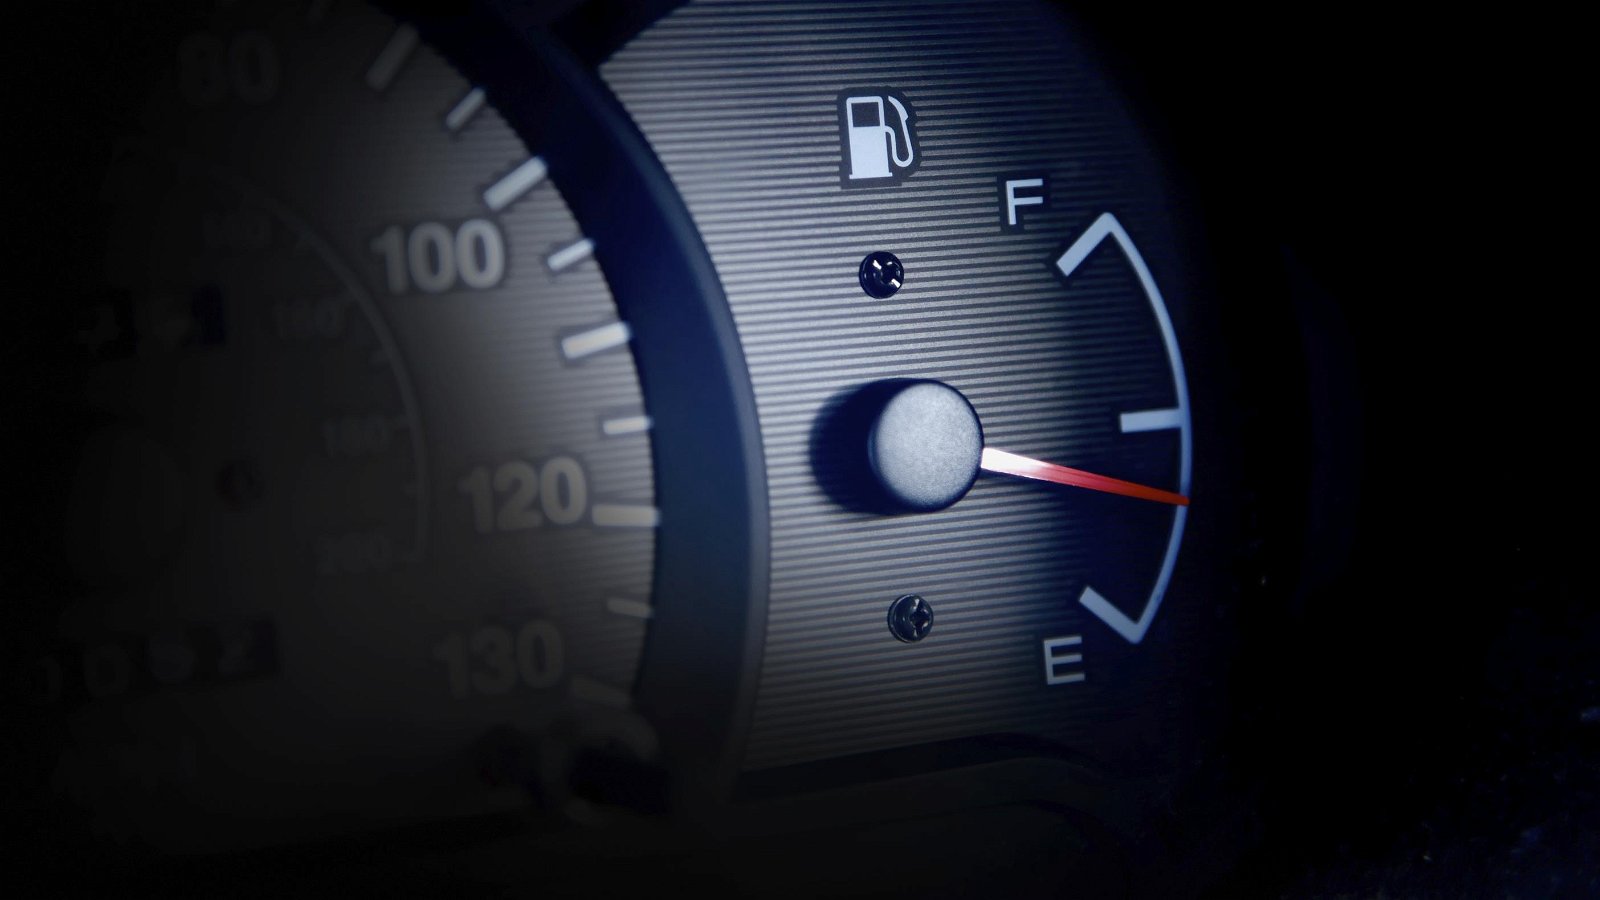
Compared to what a new car promises you regarding fuel economy, you’ll get to pay around 24% more for fuel, an independent research shows.
The honestjohn.co.uk automotive website gathered data from its users, averaging around 118,000 miles of real-world driving per user. The report highlighted the gap between the advertised mpg and how much fuel a particular model asks for, in real-world situations. In brief, only one in ten cars meets the advertised fuel consumption figures.
Now, this might not come as a real surprise. We all know by now that the New European Driving Cycle (NEDC) tests are unrelated — through their shallow procedures — to real-life driving, but the percentages of disparity in some cases can be described as worrisome.
Due to a numerous amount of critics received, the NEDC testing is going to be replaced in 2017 with the Worldwide Harmonized Light Vehicles Test Procedure (WLTP) which sounds… encompassing, but while promising more realistic figures, it will be made in lab conditions still.
With Volkswagen’s Dieselgate scandal as a prime example of how easy cheating the lab-tests is, it’s unlikely that the WLTP will change things drastically. Some car manufacturers decided to have a more transparent approach regarding their models’ fuel economy and CO2 emissions. PSA, for example, developed a platform that estimates your car’s fuel consumption depending on various filters — the model, the urban/highway ratio, the average number of passengers, or the driver’s behavior — the user itself chooses.
Honest John’s research uses a similar platform — albeit more straightforward — to gather data from more than 56 brands (and their subsequent model lineup). The user input comes exclusively from the UK, so while it may vary from country to country, it’s still a good indicator of how much more thirsty your car actually is.
As a brief explanation, the percentage shown for each model below is the difference between claimed MPG and the real one. For example, if a car has an 80% rating and a claimed 35 mpg (8,0 liters/km) in combined cycle, a more realistic fuel economy would be 80/100×35=28 mpg (10,0 liters/km). Now, let’s see the honest models, and the biggest liars in the UK:
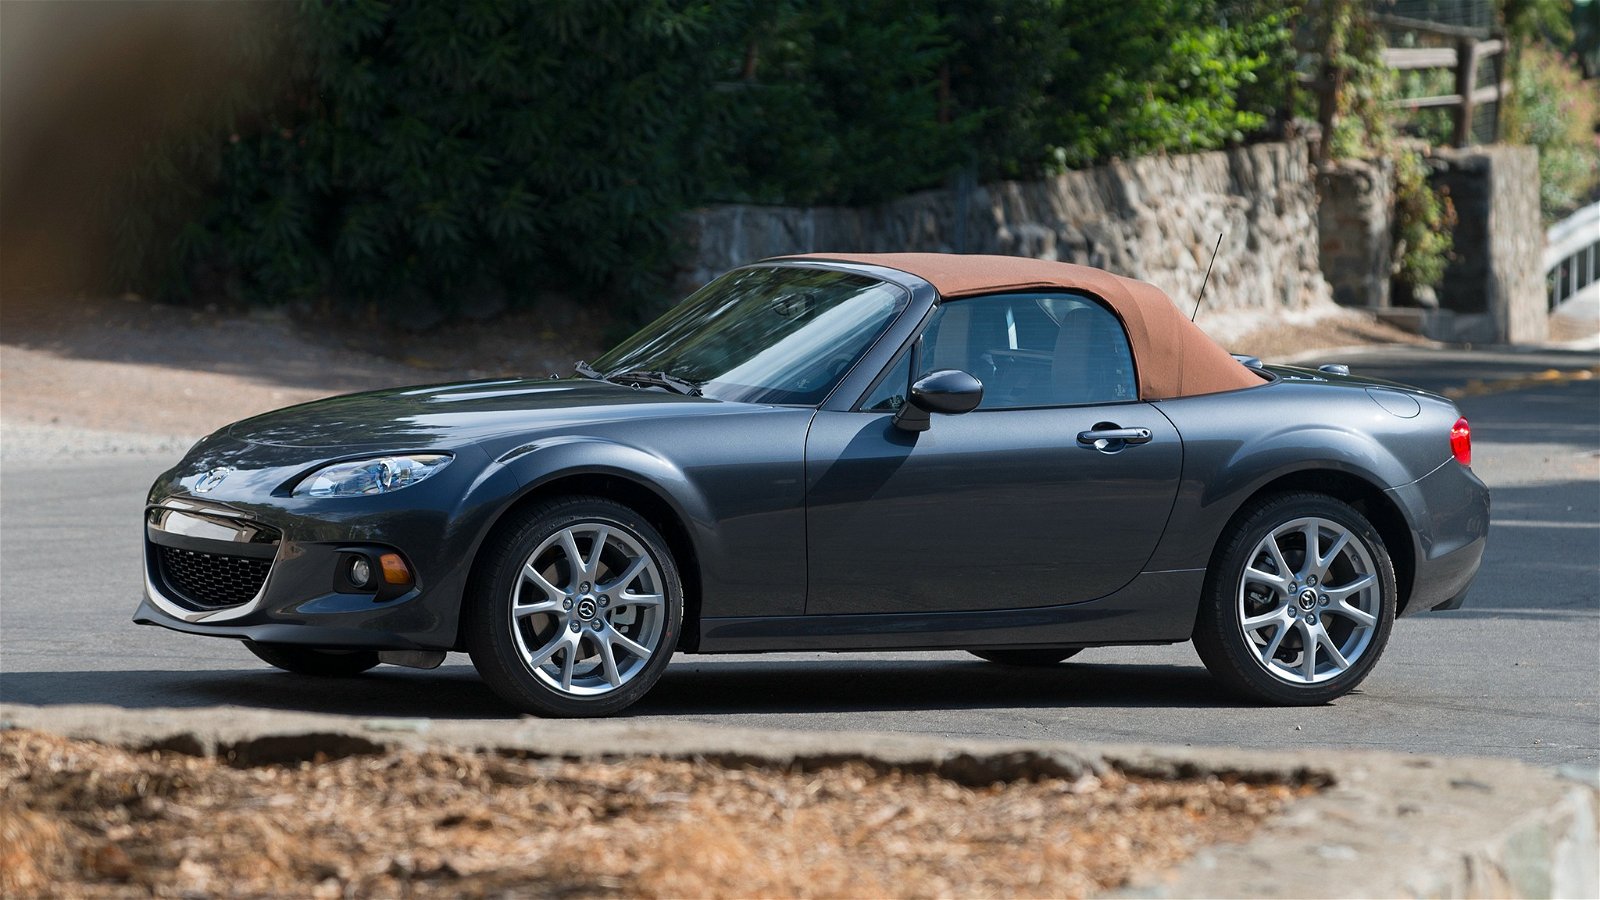
The best:
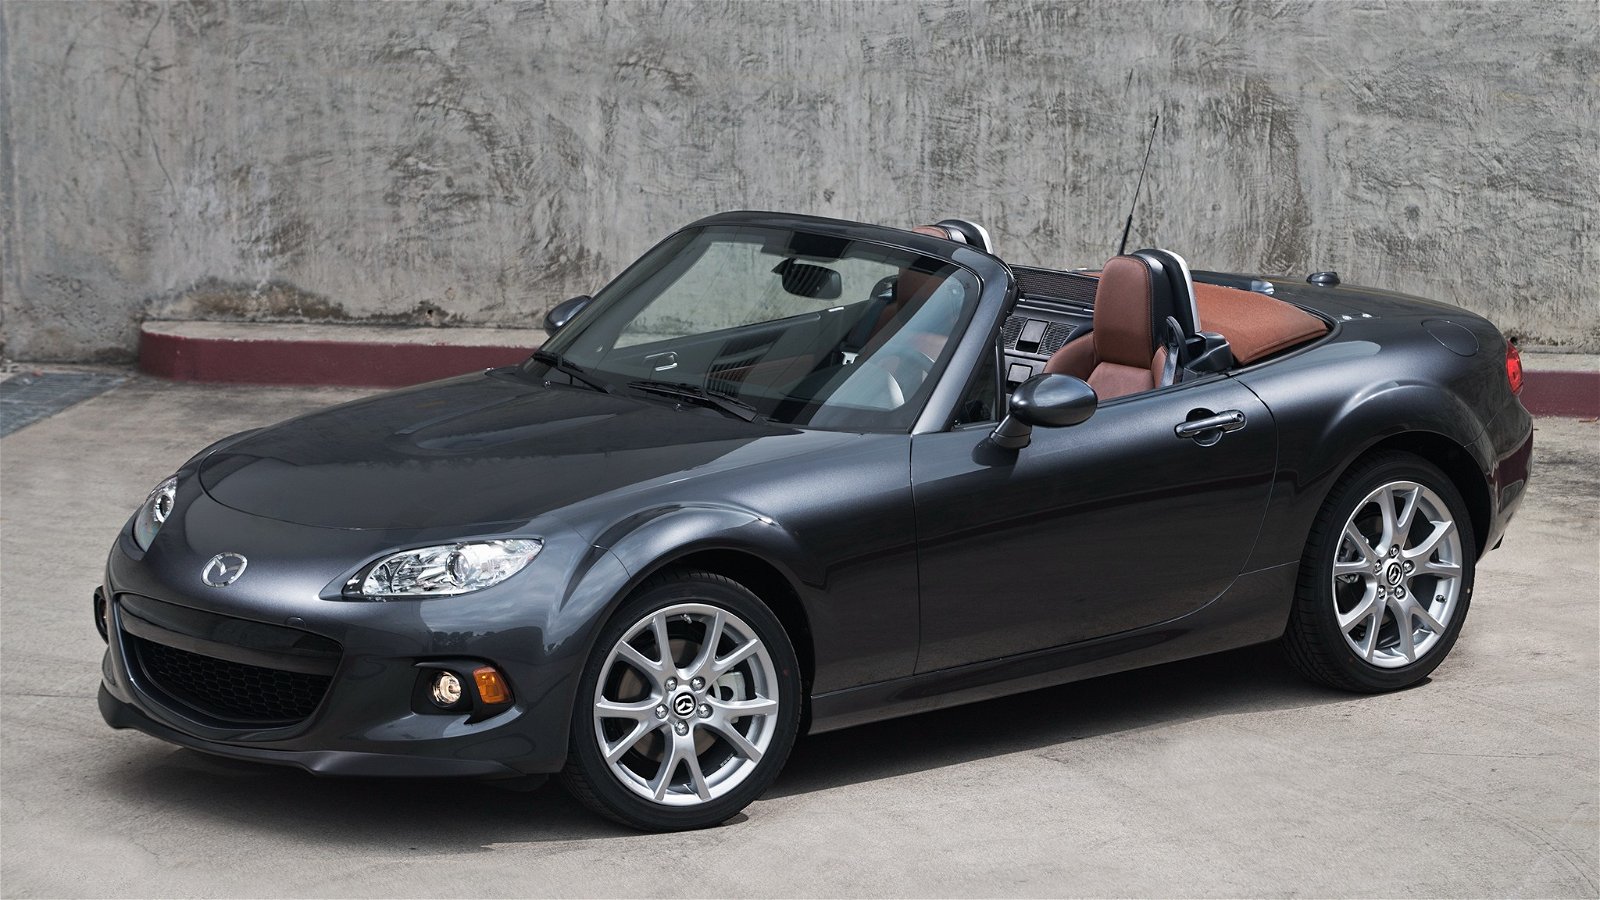
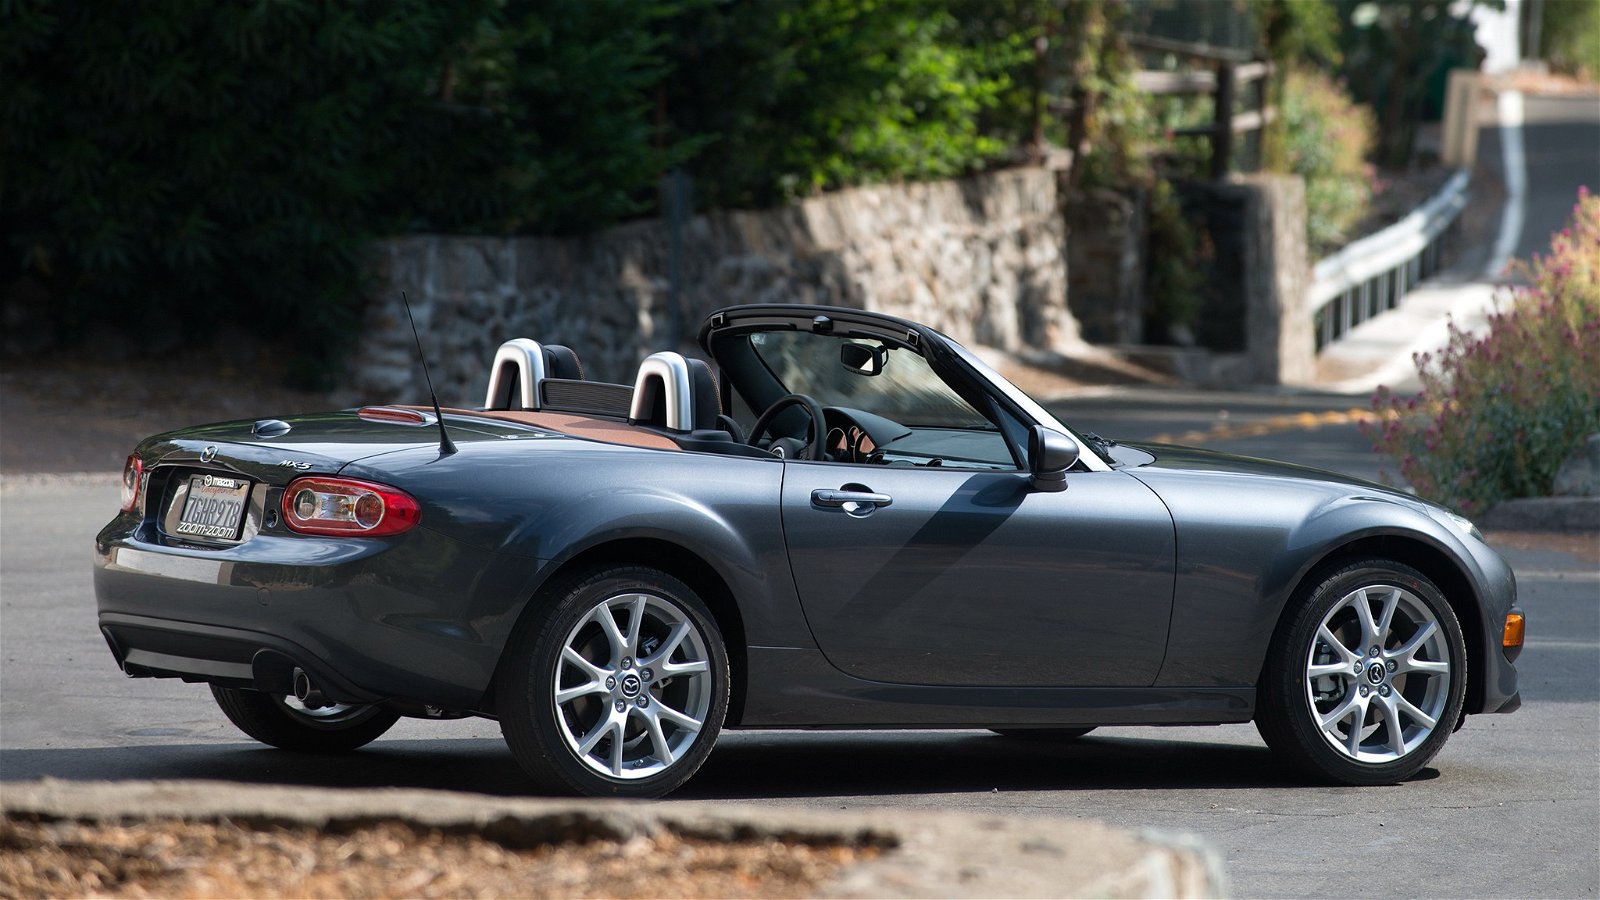
1) Mazda MX-5 — 101.5% (read our test here)
2) Toyota Verso — 99.5%
3) Toyota GT86 — 98.4%
4) Subaru Forester — 97.1%
5) Peugeot Partner Tepee — 92.9%
6) Suzuki SX4 S-Cross — 92.0%
7) SEAT Mii — 90.6%
8) Volkswagen Jetta — 90.4%
9) Suzuki Swift — 90.1%
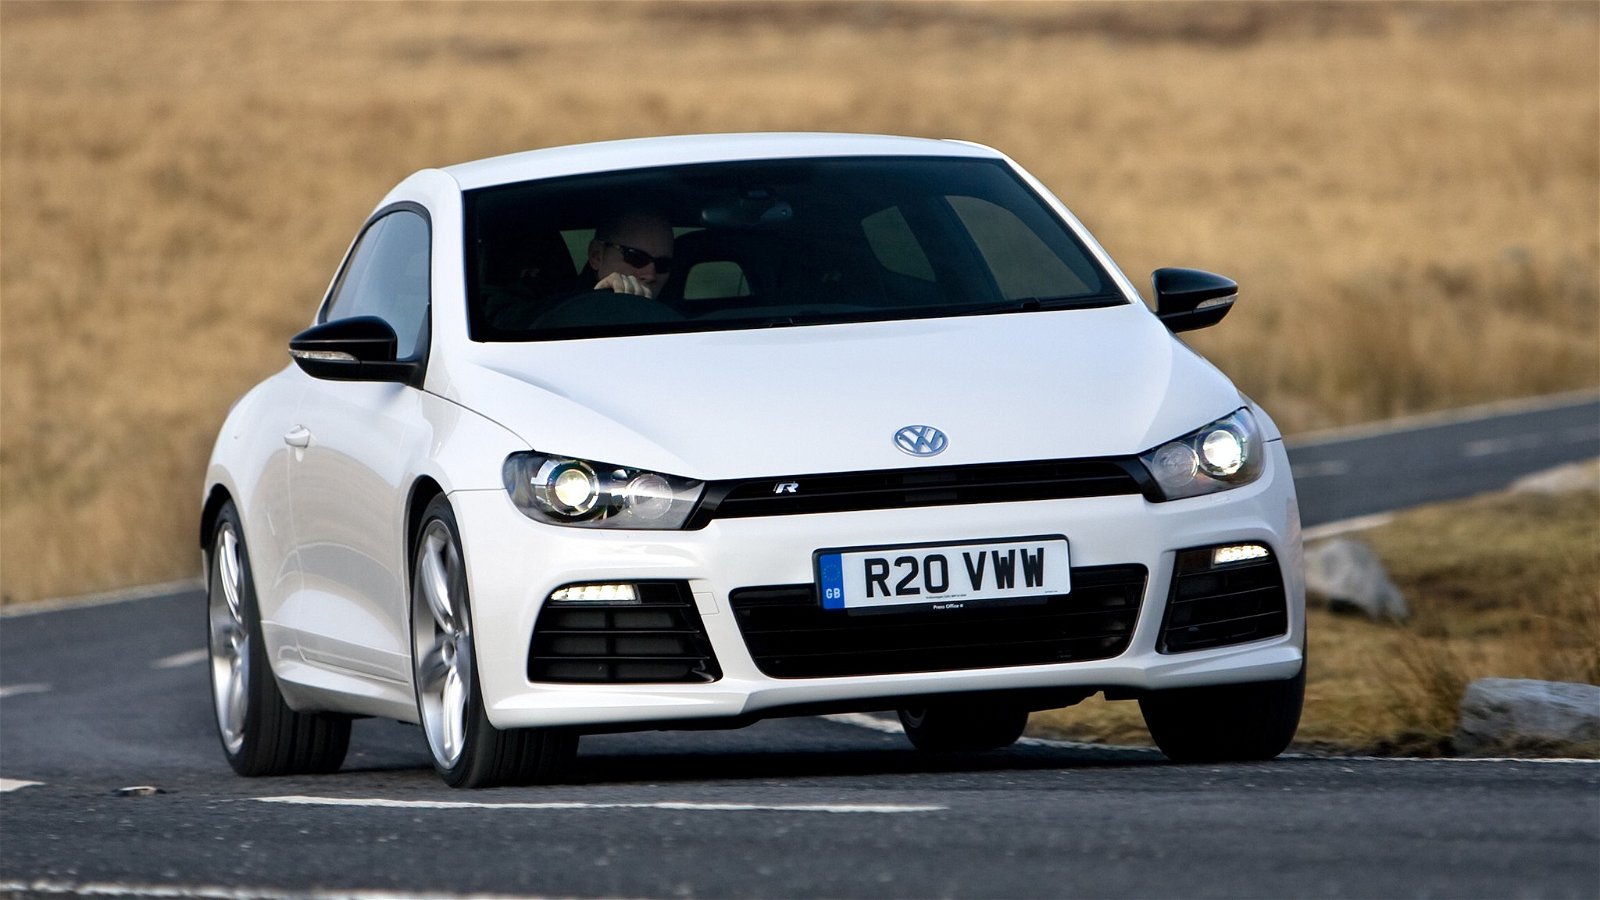
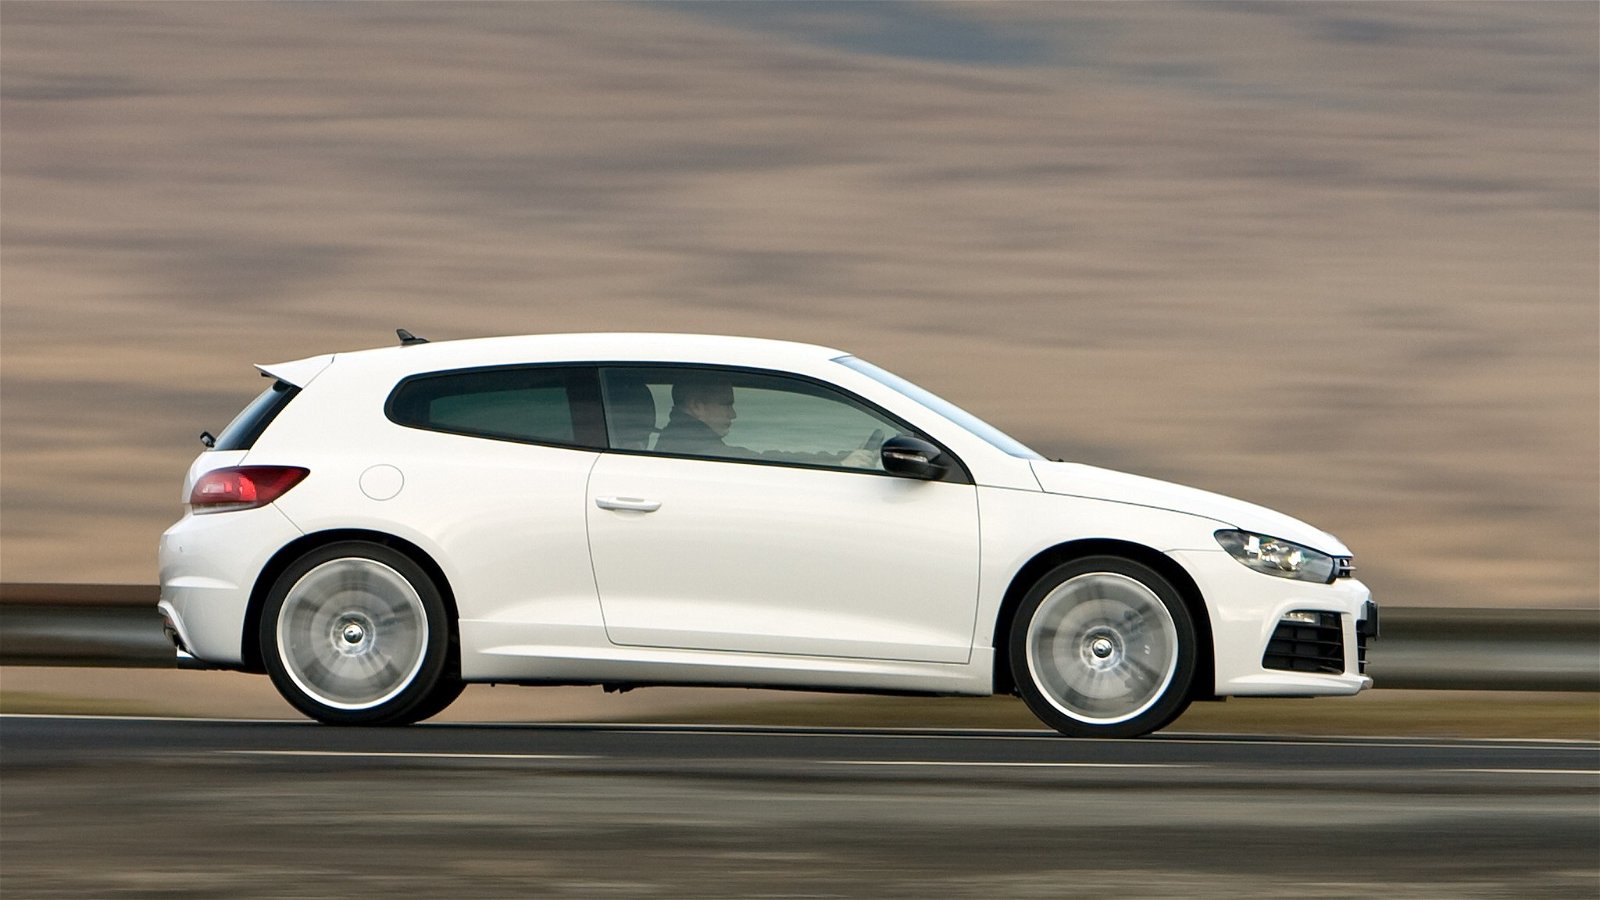
10) Volkswagen Scirocco — 88.6%
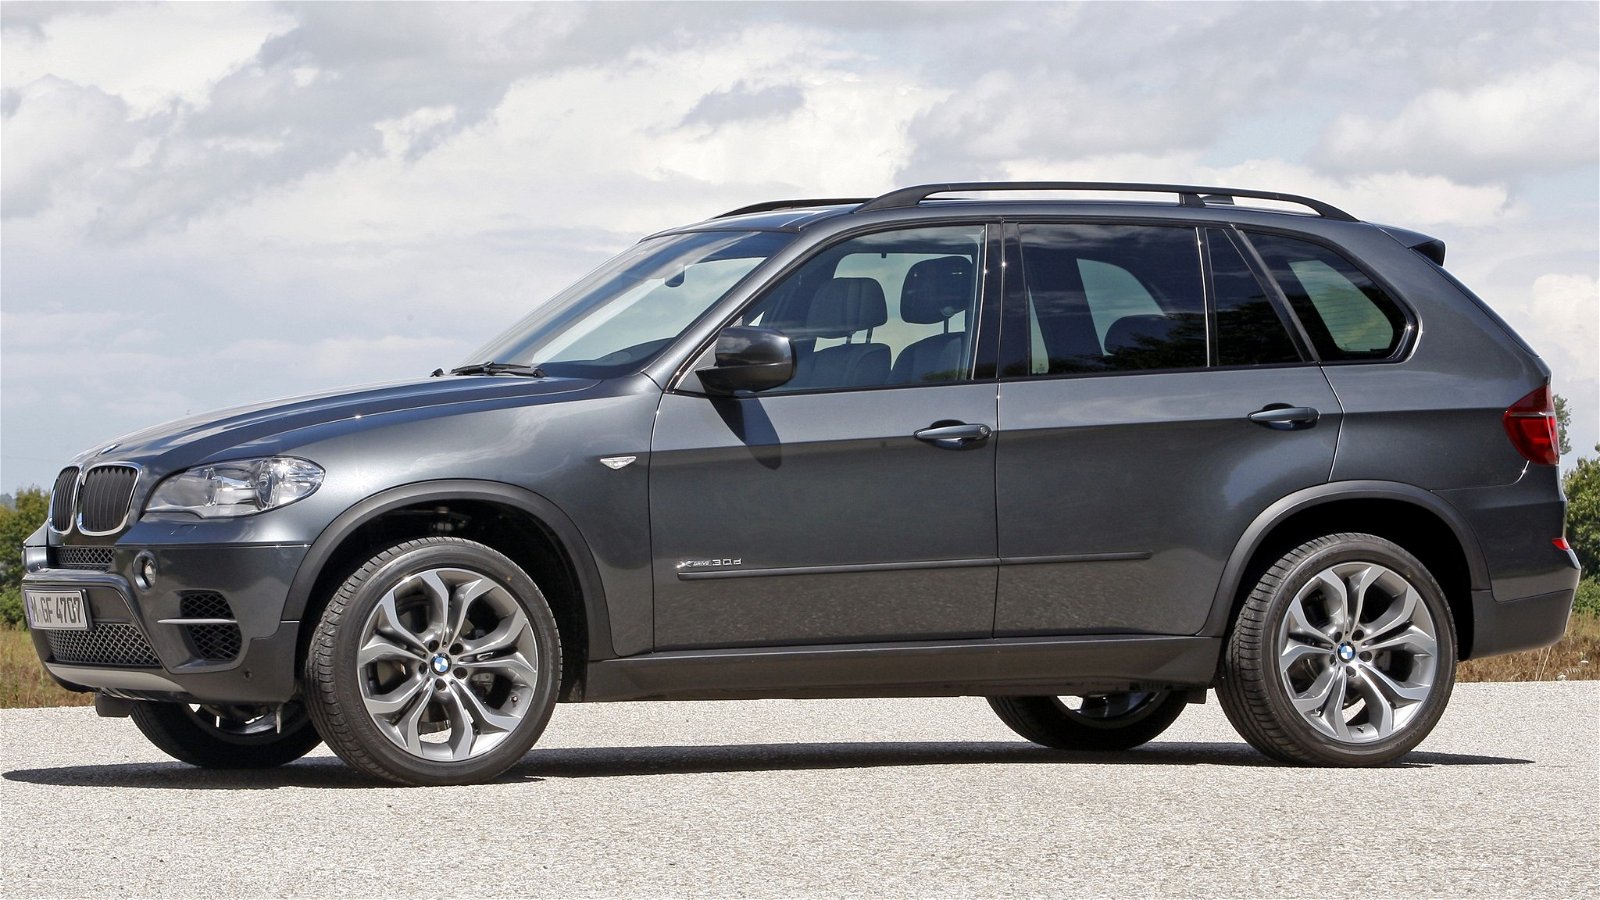
The worst:
1) BMW X5 — 66.9%
2) Land Rover Discovery Sport — 67.5%
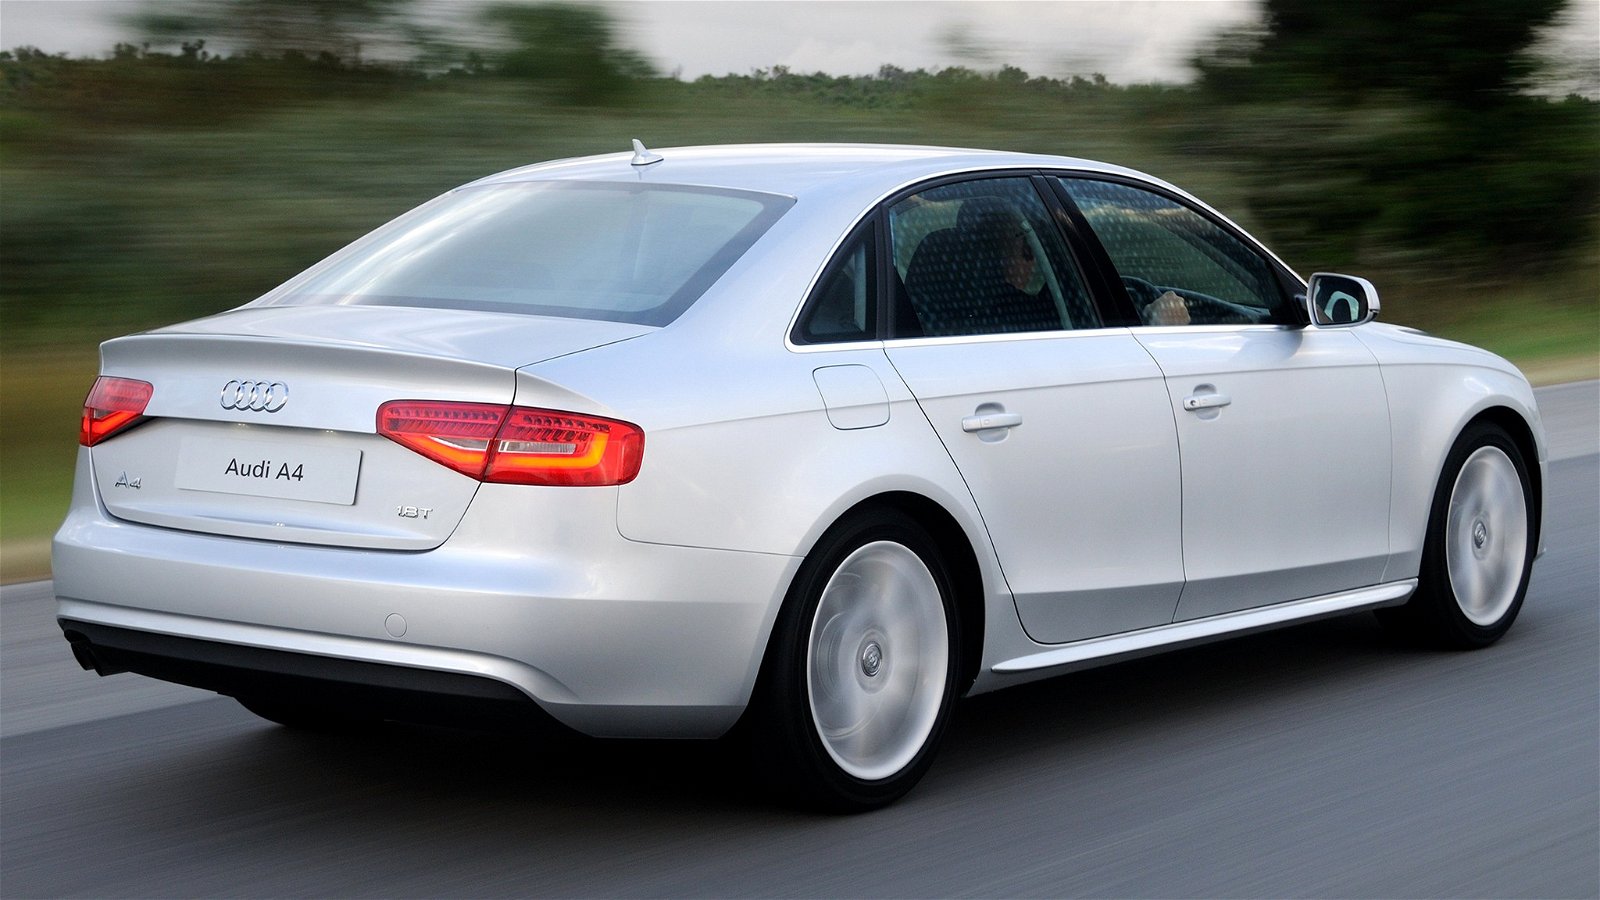
3) Audi A4 — 68.3%
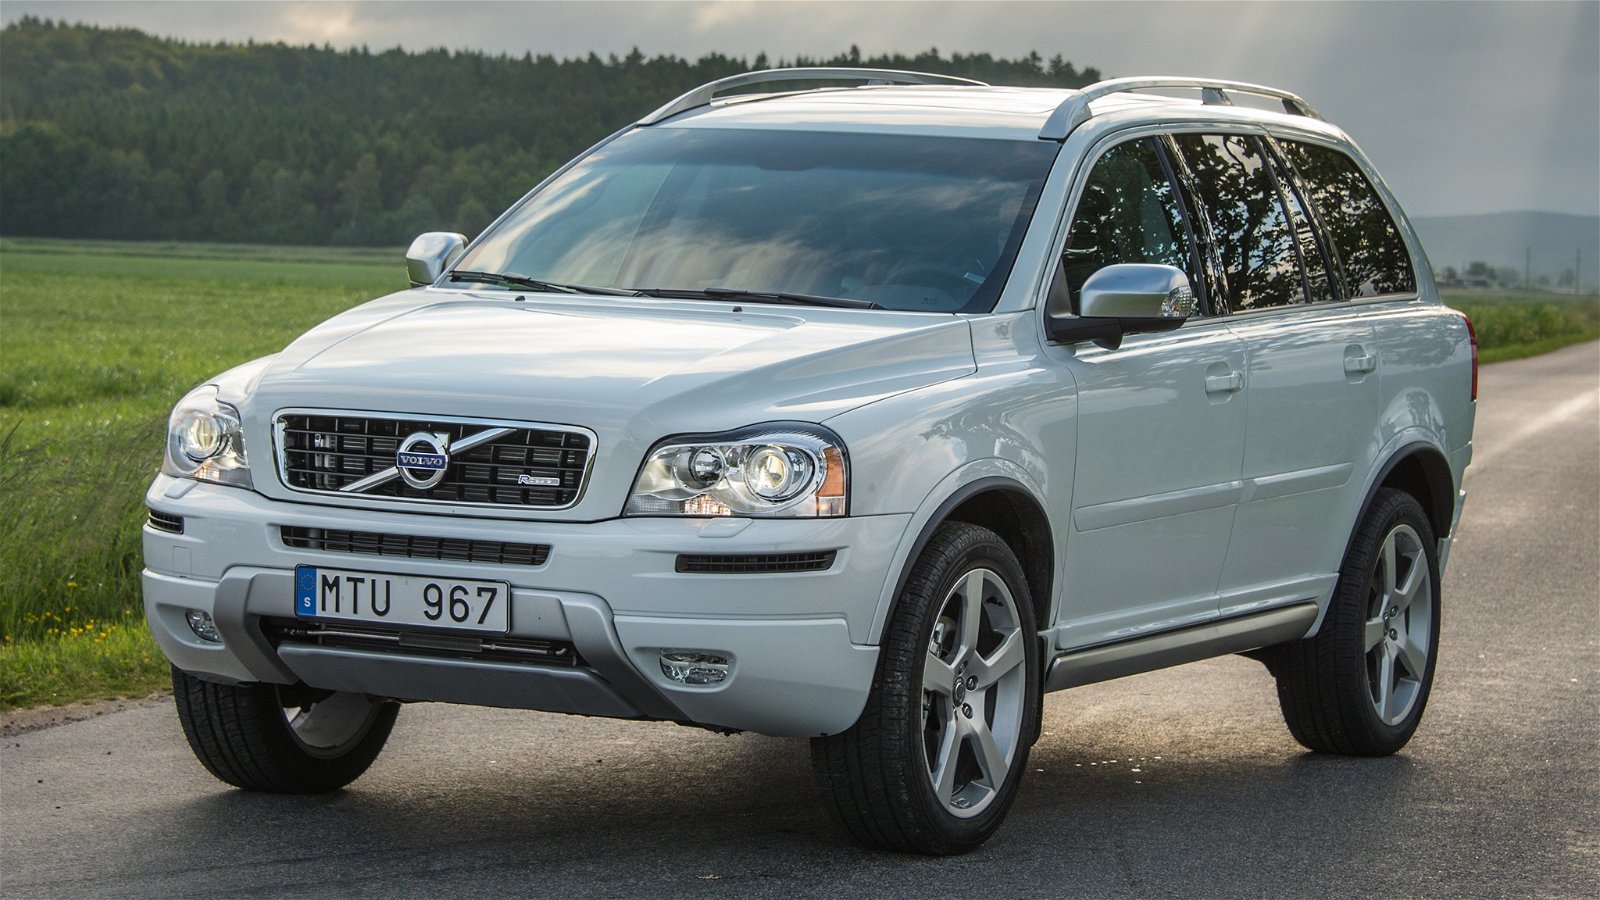
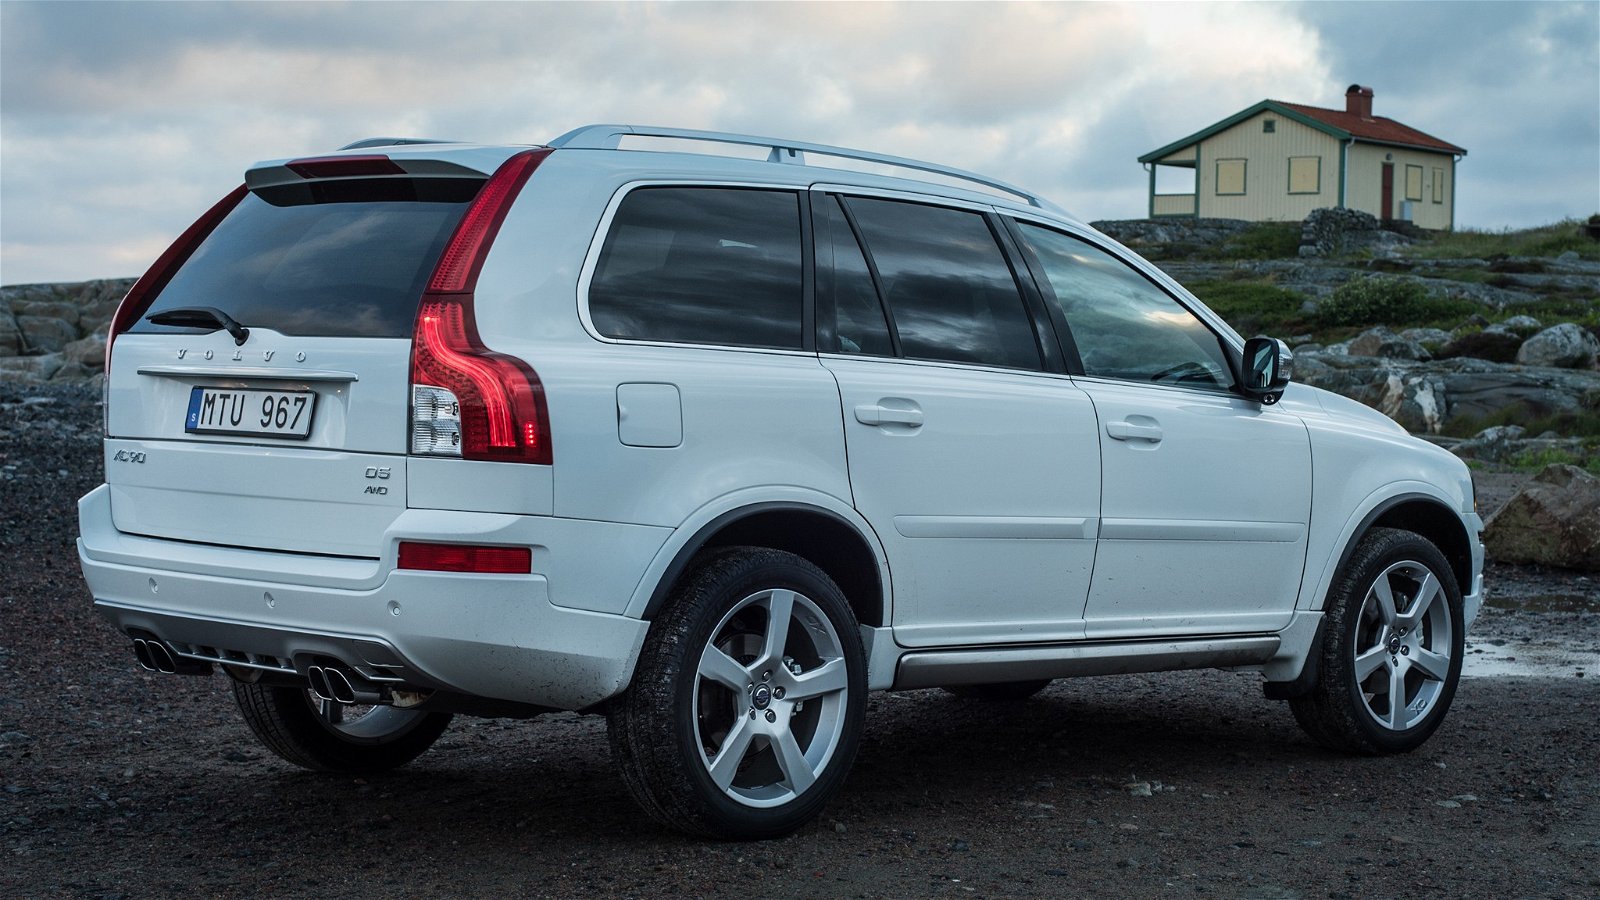
4) Volvo XC90 — 68.5%
5) Fiat 500X — 69.6%
6) MINI Hatch — 70.0%
7) Peugeot 308SW — 70.2%
8) Range Rover Evoque — 70.4%
9) Ford Fiesta — 71.0%
10) Hyundai Tucson — 71.3%
Is your car on any of these lists? Regardless, how much does your car return, regarding the fuel consumption figures, compared to the official figures?